Penetrance
Used for Mendelian variants
Of people with this genotype, what percent develop the disease over a lifetime?
Range: 0% – 100%
Example: HFE C282Y homozygotes have ~70% lifetime risk of iron overload.
Heritable Health surfaces genetic-risk variants drawn from peer-reviewed research, GeneReviews, and ClinVar. This guide explains how to read each card - the metrics, the evidence tiers, and how to talk about your results with a clinician.
Geneticists use different units depending on whether a variant causes a single disease (Mendelian) or contributes a small effect to a complex disease alongside many others. Our cards show whichever number is appropriate for that variant.
Used for Mendelian variants
Of people with this genotype, what percent develop the disease over a lifetime?
Range: 0% – 100%
Example: HFE C282Y homozygotes have ~70% lifetime risk of iron overload.
Used for complex / polygenic variants
How much more (or less) likely is the disease in carriers compared to non-carriers?
Range: 0 – ∞ (1.0 = no effect)
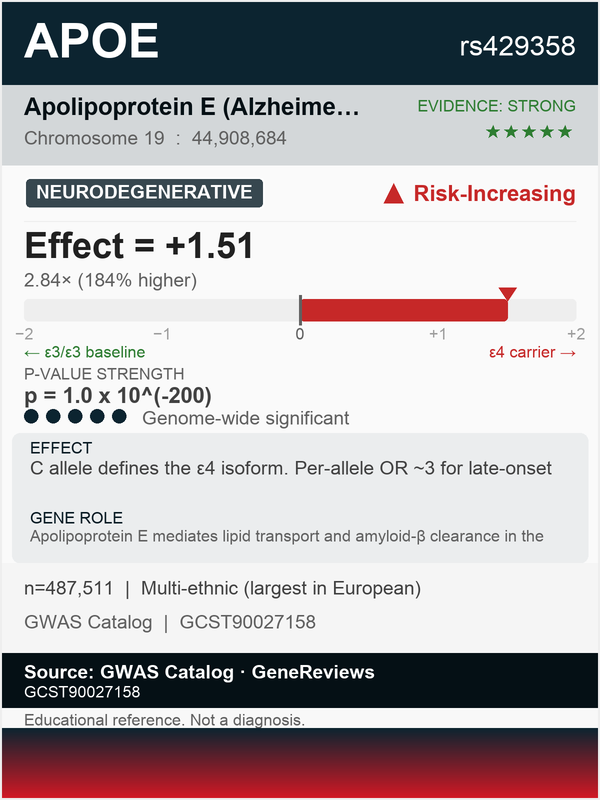
Example: APOE-ε4 has OR ≈ 3 (heterozygous) for late-onset Alzheimer's. Carriers are 3× more likely to have AD than non-carriers.
Same as OR, on a symmetric scale
The log of the odds ratio. We display this as the primary effect-size on cards because it's symmetric — equal-strength variants get equal-magnitude numbers.
Range: −∞ to +∞ (0 = no effect)
Example: log₂(2) = +1; log₂(0.5) = −1. Both represent the same magnitude in opposite directions.
| Mendelian (single-gene) | Complex (polygenic) | |
|---|---|---|
| Caused by | ONE gene with a high-impact mutation | MANY genes (often hundreds) plus environment |
| Inheritance | Predictable: dominant, recessive, X-linked, mitochondrial | No simple pattern; risk = sum of small effects |
| Number of variants | 1–few rare, high-impact | Hundreds, each tiny effect |
| Card archetype | mendelian — penetrance bar | complex_trait — log₂(OR) bar |
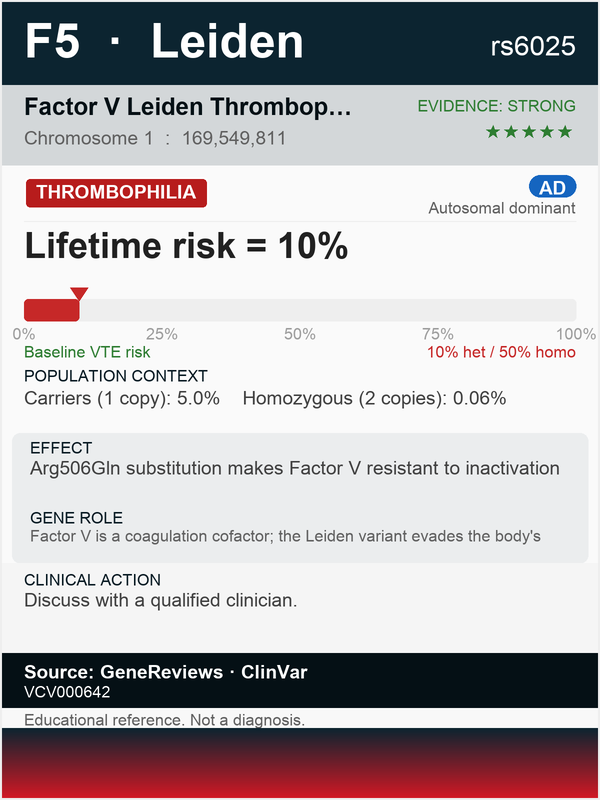
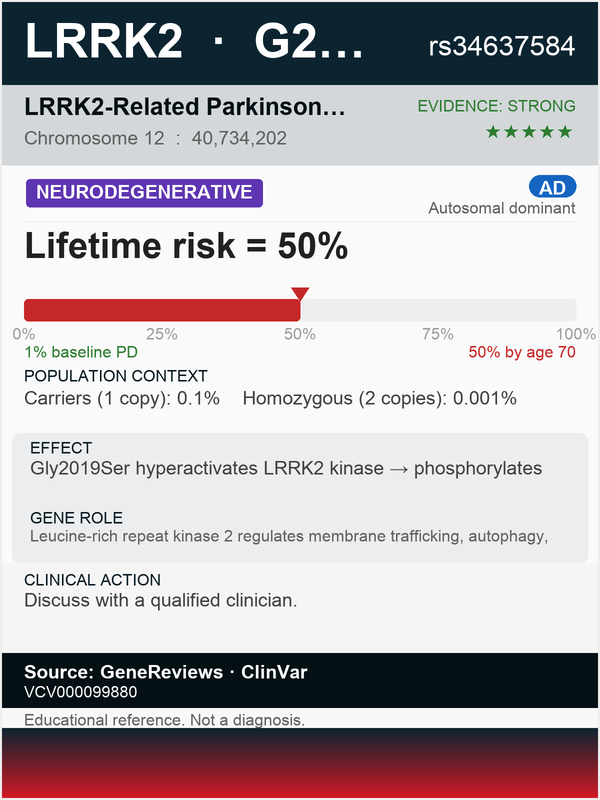
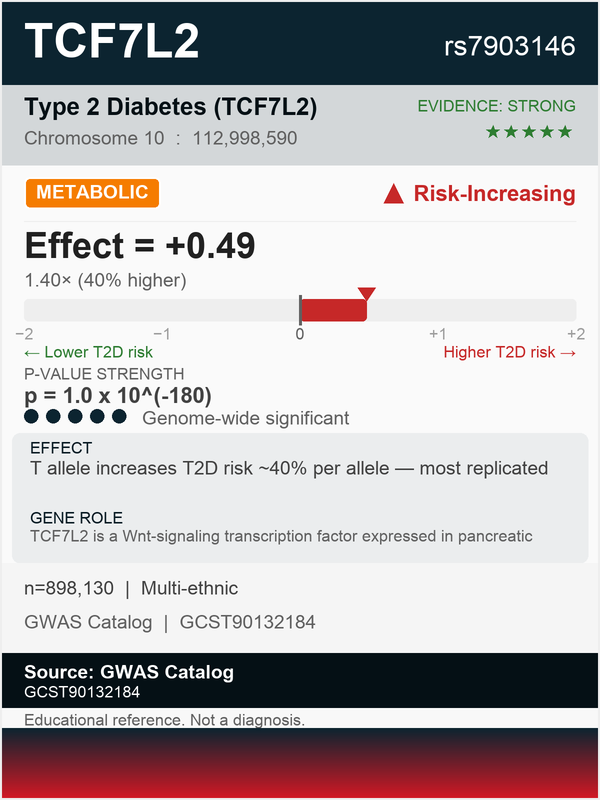
| Examples | HFE, F5 Leiden, LRRK2, BRCA1/2, CFTR | APOE/Alzheimer's, TCF7L2/T2D, FTO/obesity |
Use a log₂(OR) bar centred at 0. Negative values left of center, positive values right. Equal-strength variants are equidistant from center.
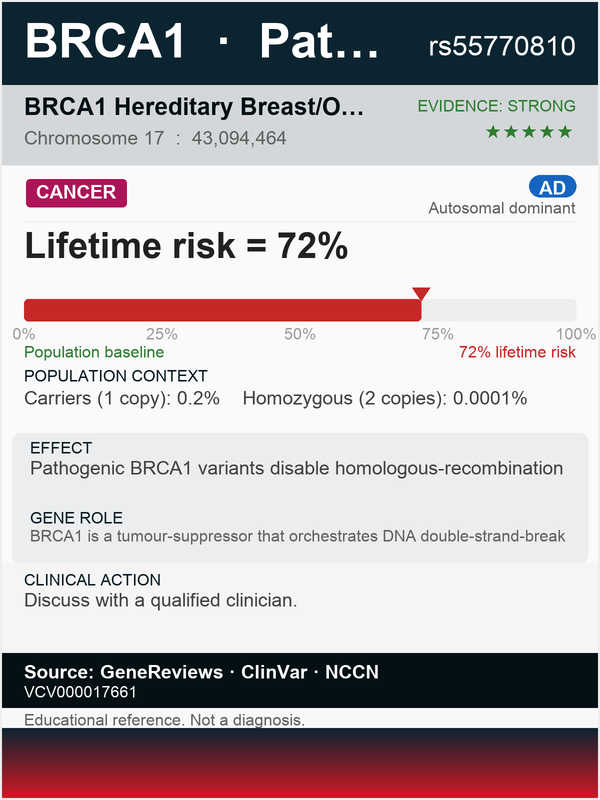
Use a 0–100% penetrance bar. Shows lifetime disease risk if you have the genotype. Includes inheritance pattern (AD/AR/XLR) and population frequencies.
Show carrier frequency by ancestry plus a couple-risk panel (1 in 4 affected children if both partners carry). Used on Paired Genes, Well Matched, and Gene Pool.
Every card carries an evidence tier badge in the top right. We assign tiers based on independent replications across multiple studies and inclusion in authoritative resources like GeneReviews and ClinVar.
| Tier | Stars | Meaning |
|---|---|---|
| STRONG | ★★★★★ | Genome-wide significant in mega-meta-analyses or GeneReviews-listed Mendelian variant. |
| VALIDATED | ★★★★ | Three or more independent GWAS replications. |
| MODERATE | ★★★ | 1–2 replications with some heterogeneity across studies. |
| EMERGING | ★★ | Single large study, awaiting independent replication. |
| EXPLORATORY | ★ | Candidate-gene-era finding with weak modern replication. Treat with caution. |
| Code | Pattern | What it means |
|---|---|---|
| AD | Autosomal dominant | One affected copy is enough to cause disease. Each child of an affected parent has a 50% chance of inheriting it. |
| AR | Autosomal recessive | Two affected copies needed. Carriers (heterozygous) are usually asymptomatic. If both parents are carriers, 25% of children are affected. |
| XLR | X-linked recessive | Mostly affects males (one X chromosome). Female carriers usually asymptomatic; 50% of male children of carrier mothers are affected. |
| XLD | X-linked dominant | Affects both sexes; daughters of affected fathers always inherit. |
| MT | Mitochondrial | Inherited only from the mother (mitochondrial DNA). All children of an affected mother inherit; none of an affected father's. |
On complex-trait cards, the bar is centred at 0 (the no-effect point). The triangular marker sits at log₂(OR), so:
Color follows the site's clinical convention. On health-focused sites, increased disease risk is shown in red. The card always lists the original odds ratio and a plain-language multiplier (e.g. “0.57× = 43% lower”) in addition to the log₂ value.
Examples of the cards you'll see when your results are ready. Each card is generated for a specific variant; what you see depends on your DNA, your ancestry, and which conditions are on this site's panel.

These cards are educational, not clinical.
Genetic risk varies enormously based on environment, lifestyle, and other genes. Always discuss results with a genetic counselor, physician, or qualified clinician before making medical decisions. The evidence-tier badge tells you how confident the science is — “EXPLORATORY” findings should not drive clinical action.